Industrial Anomaly Detection Framework
Description
An industrial anomaly detection framework is presented in [1], which is based on the Opinion Dynamics technique. Basically, the framework is designed to capture “raw traffic” of the network and deploy a set of software agents in each device of the system. Each agent analyzes and compares the information managed or received with the normal behavior of the device (e.g., looking at state values related to the communication such as quality of service, format/type of packets or bandwith, as well as the states of the own node such as memory or CPU). In this sense, the Opinion Dynamics algorithm is applied to correlate the anomaly values of each agent with respect to the behavior of their neighborhood, returning in this case diverse (local and global) health indicators. The anomaly-based detection system is particularly composed of three main components:- Collector component: This component receives, collects, filters, classifies and dissects the raw traffic. This traffic is analyzed to generate a list of events with the necesary information, and associates this information with the information produced by the surrounding of each node.
- Detector component: This component creates dynamically an agent for each device in the system. Each agent analyzes its event list and determines the percentage of anomaly in each device.
- Correlator component: This component applies the Opinion Dynamics algorithm to correlate the anomaly of each agent with respect to their surrounding.
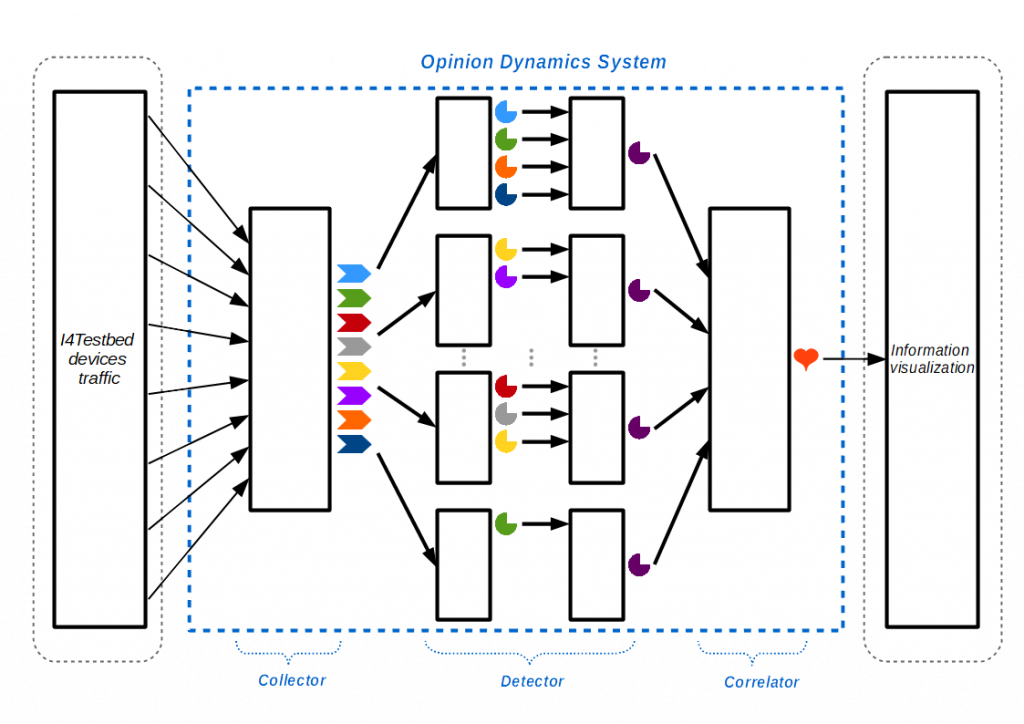
The framework has been implemented and executed in the NICS Lab domains to test and validate its effectiveness in constrained contexts. To do this, a complex threat vector based on four different attacks (illegitimate connection, scanning, covert channel, destruction) haven been also planned and launched on the IIoT-Testebed.
Results
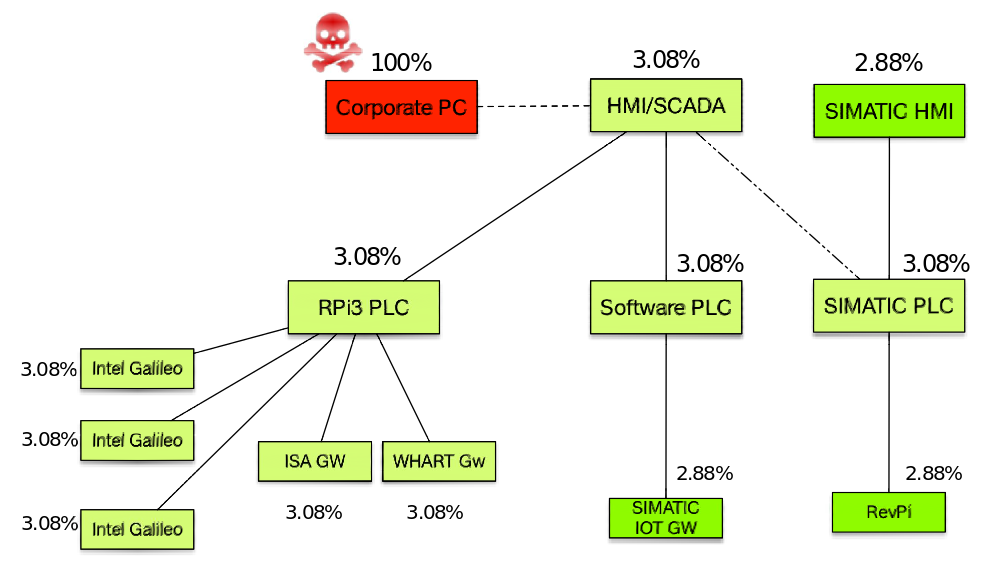
- Attack 1: Unusual connection via SSH between corporative computer (192.168.0.160) and HMI/SCADA (192.168.0.2)
- Start time: 11:35 h-UTC (timestamp 1554291355)
- End time: 11:36 h-UTC (timestamp 1554291410)
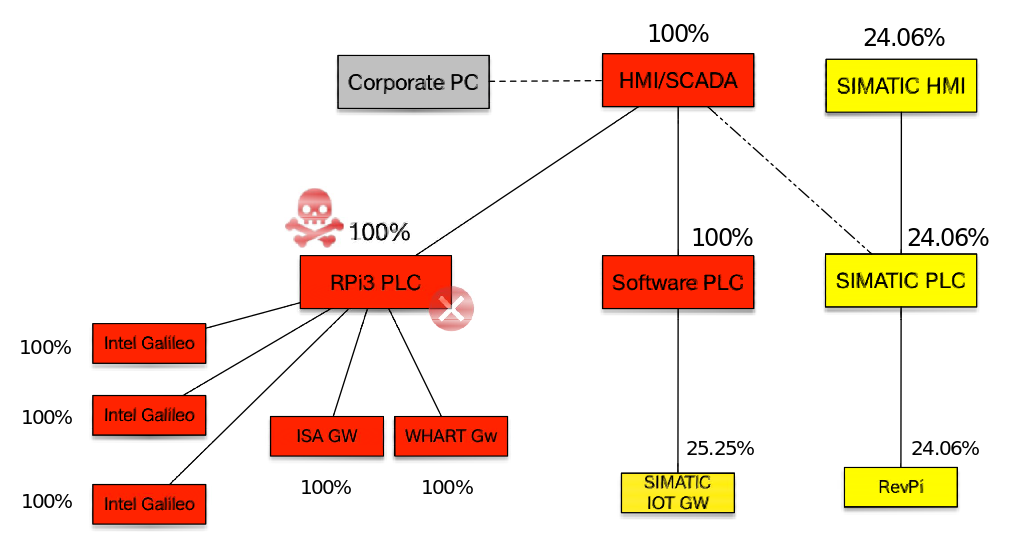
- Results of attack 1. The percentages of anomalies of the system devices after the first attack action is shown in the next figure (see also [1]):
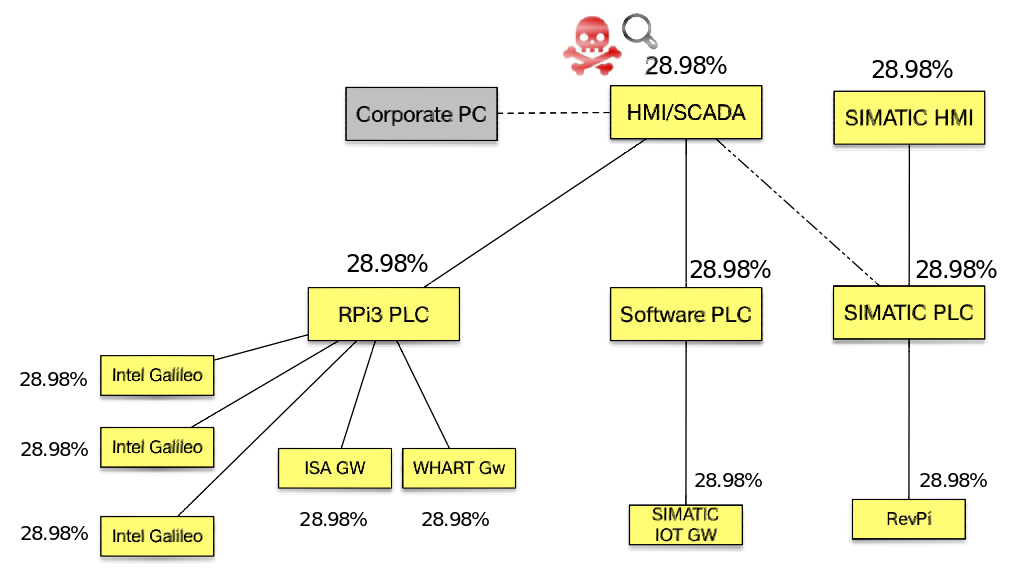
- Attack 2: Scanning the industrial network with nmap command on Linux from HMI/SCADA (192.168.0.2)
- Start time: 12:35:01 h-UTC (timestamp 1554294901)
- End time: 12:35:42 h-UTC (timestamp 1554294942)
- Results of attack 2. The percentages of anomalies of the system devices after the second attack action is shown in the next figure (see also [1]):
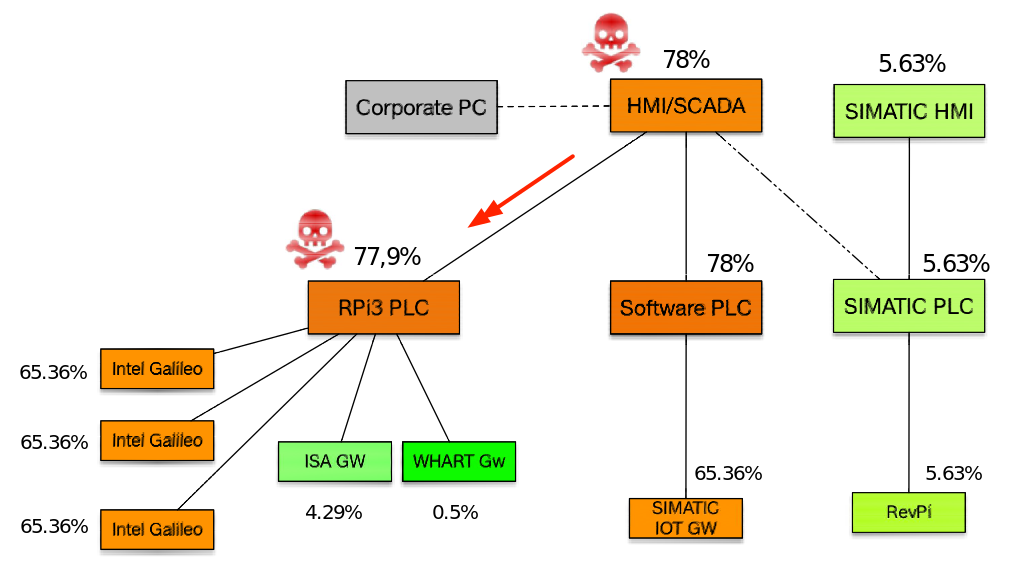
- Attack 3: Establishment of covert-channel using a ModBus TCP communication existing link between the SCADA (192.168.0.2) and PLC (192.168.0.51).
- Start time: 13:36 h-UTC (timestamp 1554298588)
- End time: 13:38 h-UTC (timestamp 1554298688)
- Results of attack 3. The percentages of anomalies of the system devices after the third attack action is shown in the next figure (see also [1]):
- Attack 4: Shutdown of the PLC (192.168.0.51).
- Start time: 14:37 h-UTC (timestamp 1554302265)
- End time: 15:39 h-UTC (timestamp 1554305967.057748)
- Results of attack 4. The percentages of anomalies of the system devices after the fourth attack action is shown in the next figure (see also [1]):
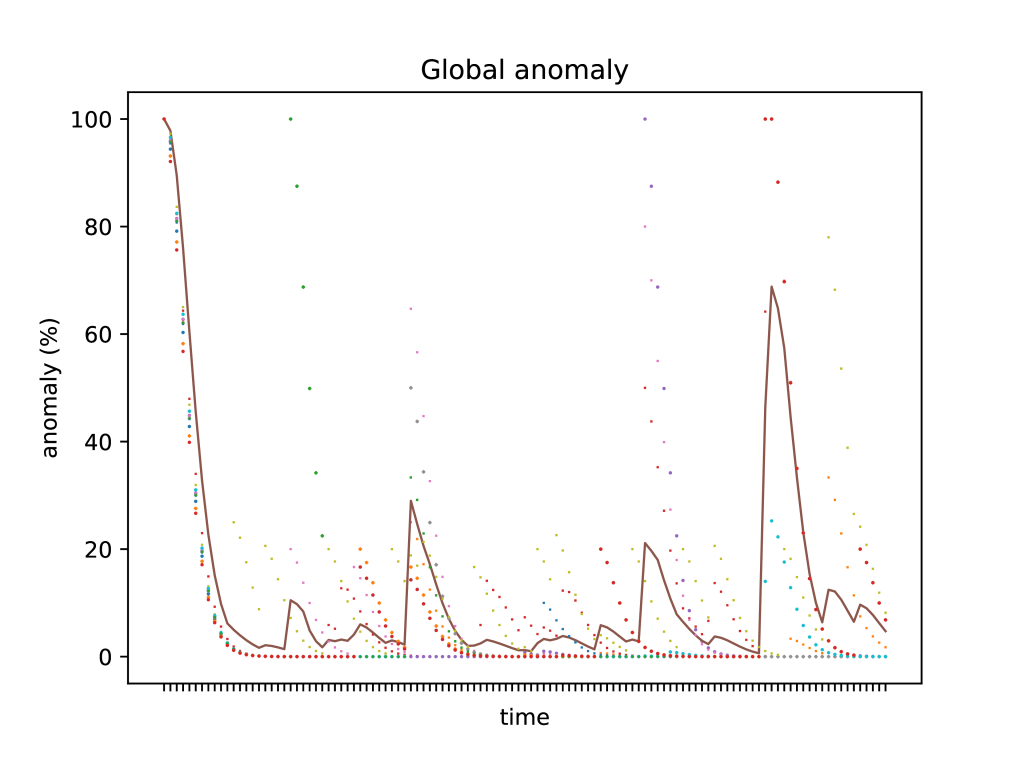
The evolution of the anomaly states over time and regarding the four actions of attacks is shown in the following graph.
Traffic captures:
- Traffic capture of normal behavior: CaptureOfNormalBehavior.pcap
- Traffic capture with attack actions: CaptureWithAttacks.pcap
References
- Juan E. Rubio and Rodrigo Roman and Cristina Alcaraz and Yan Zhang (2019): Tracking APTs in Industrial Ecosystems: A Proof of Concept. In: Journal of Computer Security, vol. 27, pp. 521-546, 2019, ISSN: 0167-4048.

